Technology
Vibration monitoring for disk racks
The problem
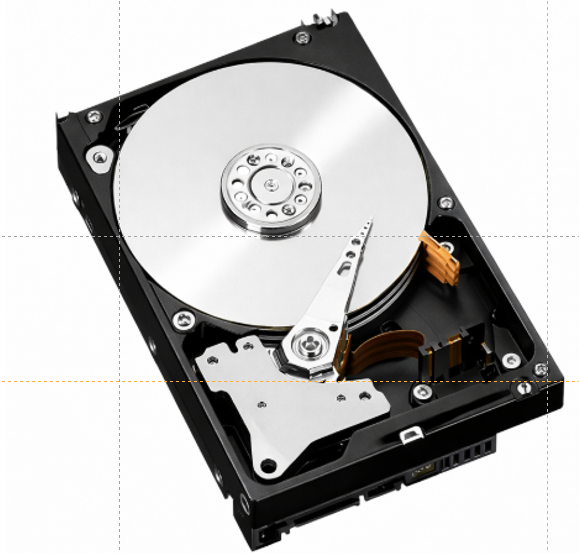
Excessive vibrations within disk racks from failing spinning hard drives and cooling fans puts damaging stress on other hard disk drives and reduces their longevity. Reduced disk longevity costs money and reduces productivity.
Our approach
Remote Nexus produces small, highly affordable units that measure mechanical vibrations within disk racks on a 24/7 basis. The units send warnings to IT professionals via text or email when chronic vibrations are detected as a warning that a disk drive may be failing. Vibration sources can then be remedied, thus saving our clients money and loss of productivity.
The Model RN3
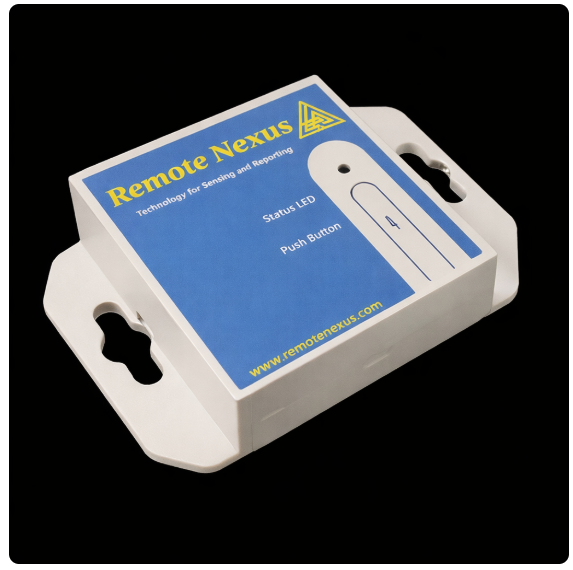
The unit shown here is a prototype of the Model RN3. Typically, one or two RN3 devices are installed on each disk rack. The devices require no maintenance on the part of the client. Software updates are automatically provided by Remote Nexus and installed via wireless connections.
When the Model RN3 is powered up it runs a proprietary learning algorithm that characterizes the vibration environment it observes over a preset time period. The RN3 then periodically samples the vibration field, characterizes any significant changes that it sees, and informs the client IT professional of anomalously large or consistently growing vibration amplitudes. The IT manager can then act accordingly to mitigate excess vibrations and minimize damage caused by them.
Availability
The commercial Model RN3 is anticipated to be available in Q1, 2027.
Please contact:
sales@remotenexus.com
The Argus application
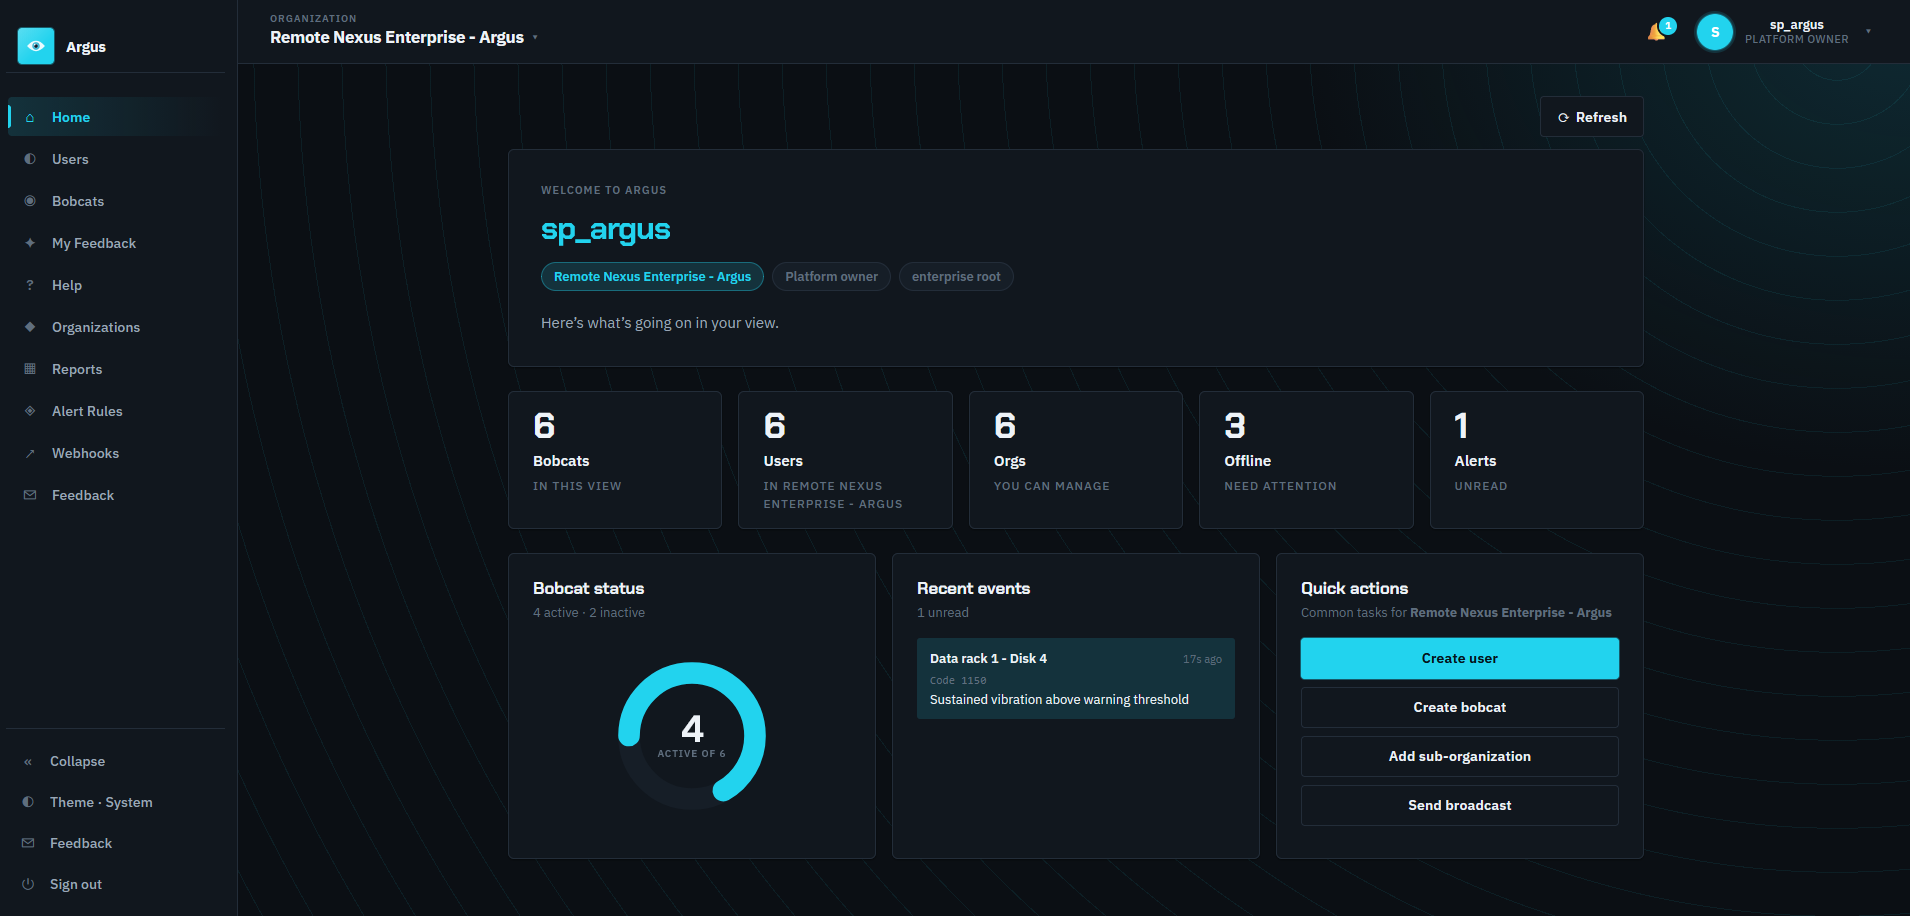
Every RN3 reports into Argus, the secure web application supplied with the units. Argus gives IT staff a single view of the whole fleet — which units are active, which have gone quiet, and what each one is measuring.
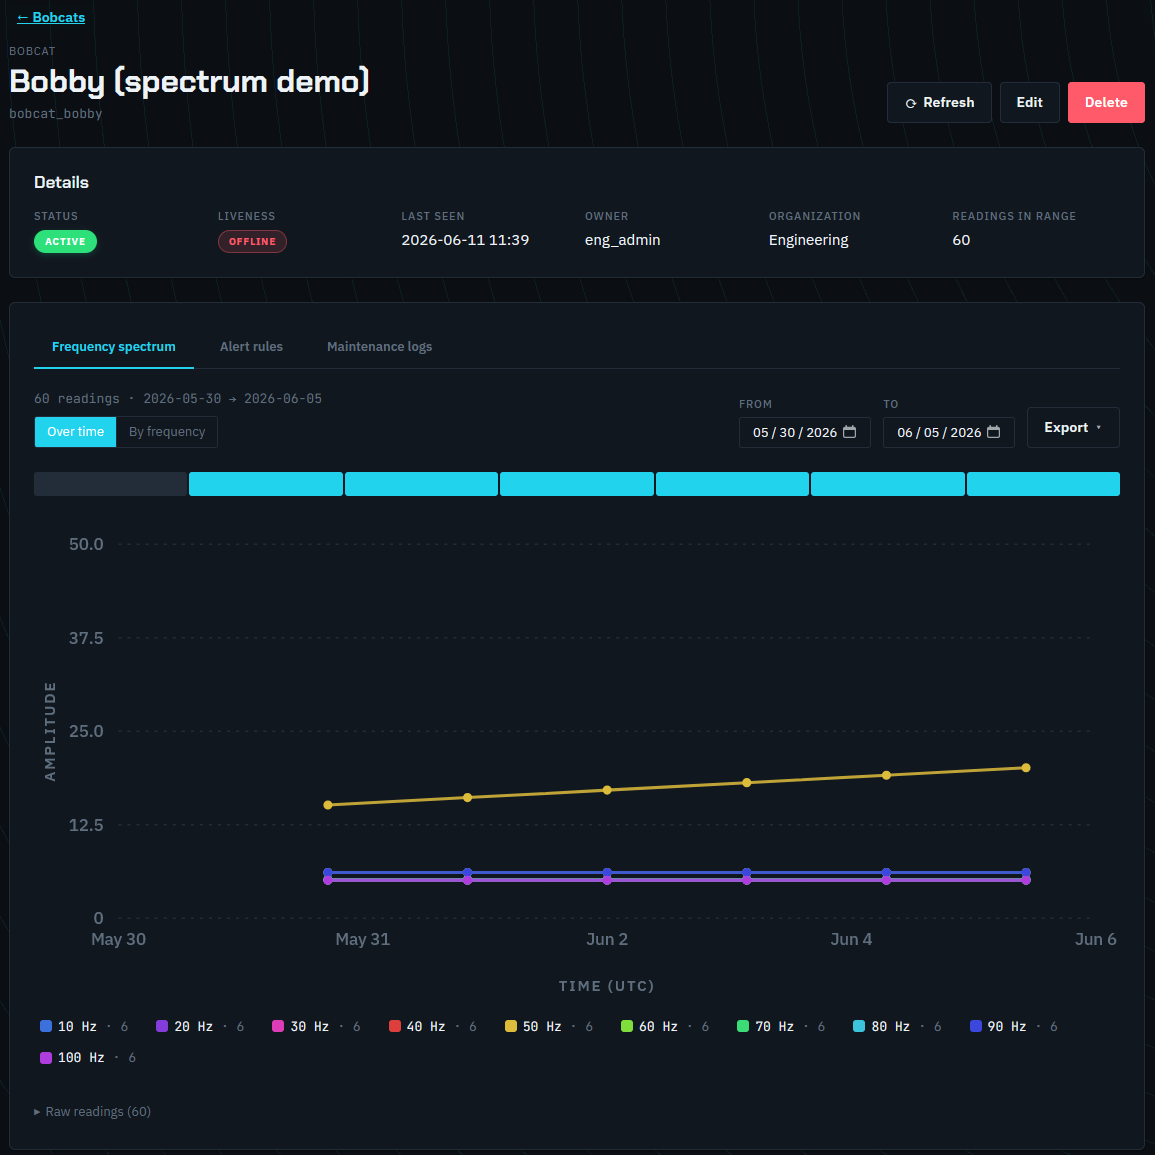
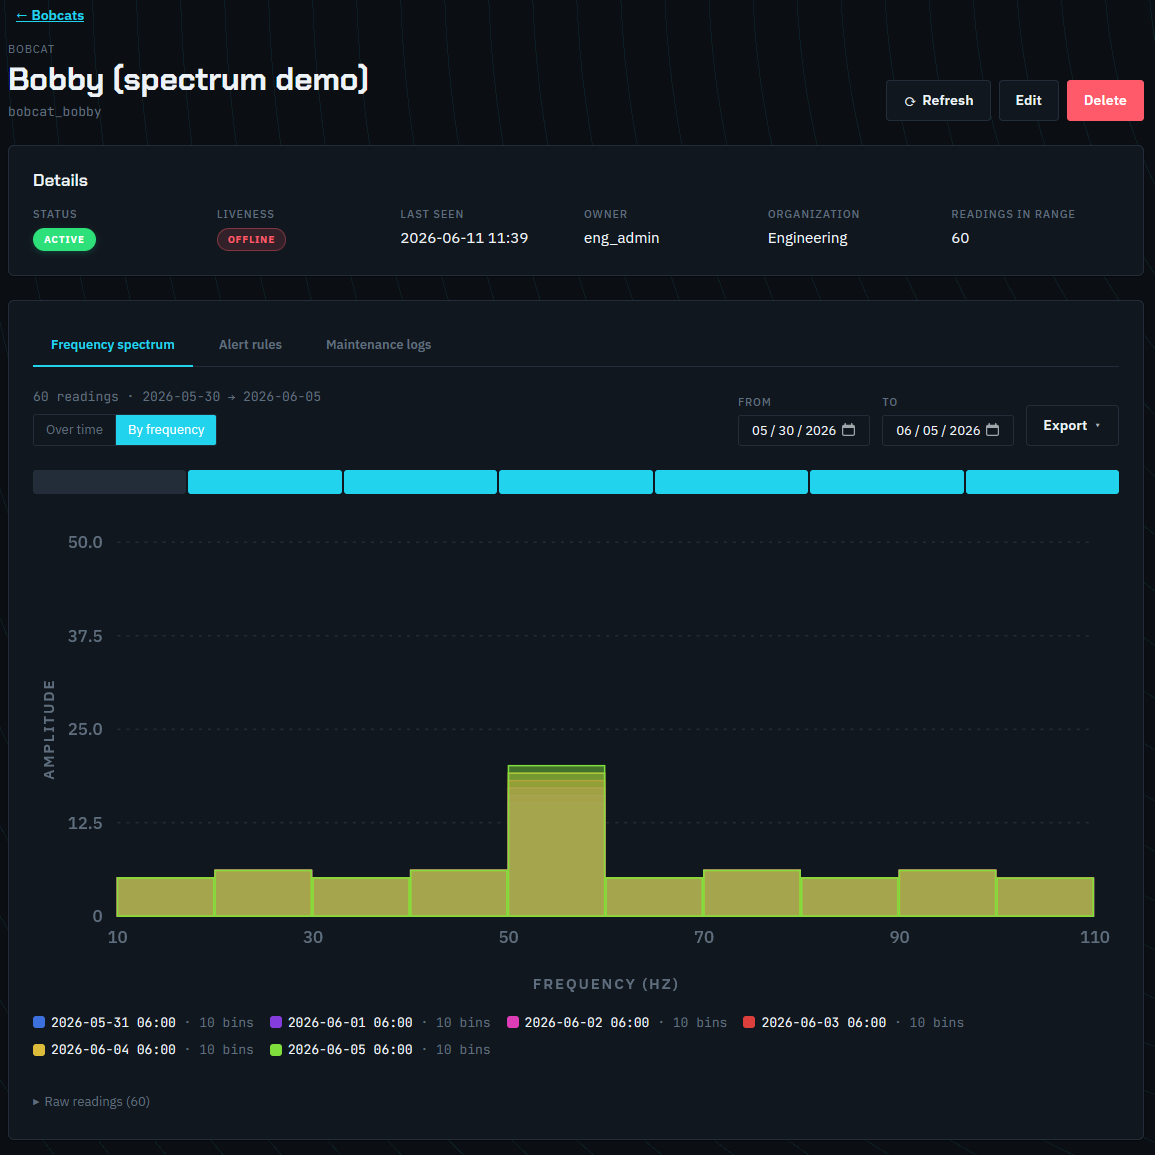
Readings are kept as a time series and can be read two ways. Plotted against time, a single frequency band creeping upward gives a failing drive away well before it fails; plotted across the frequency range, the same readings show where in the spectrum that energy sits. Administrators set amplitude thresholds on one unit or across an entire organization, and choose the severity attached to each.
- Fleet status, offline detection and unread alerts at a glance
- Frequency-spectrum history for every unit, over any date range
- Threshold alert rules per device or per organization
- Alerts in the app, by email, or forwarded to your own tooling
- Maintenance logs, and data export as CSV or JSON